Plot graphs and determine gradients, intercepts and constants
Process results, build graphs and evaluate conclusions.
Choose axis quantities and labels
Follow the axes specified in the question; generally, the independent variable goes on the horizontal axis and the dependent variable on the vertical axis. Label each physical quantity, unit and any required power of ten clearly. Separate the quantity and unit with a slash, for example F/N and x/m, or resistance R/Ω and length L/m.
Choose scales
The range of independent-variable and dependent-variable data should each cover at least half of the available grid in its direction. Use easy-to-read scale steps such as 1, 2, 5 or 10, avoiding awkward steps such as 3 or 7. The axes need not start at zero. Scale values increase from left to right on the horizontal axis and from bottom to top on the vertical axis. Label values no more than three large squares apart; marking every two large squares is recommended.
Plot points
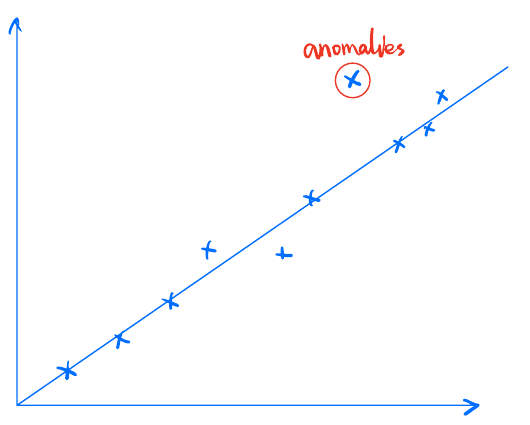
Plot all required data points from the table, with at least six points, and keep every point inside the grid. Use a sharp pencil to draw small crosses accurate to half a small square. Avoid thick dots and points obscured by the fitted line. Identify clearly anomalous points and mark them as appropriate to the question.
Best-fit line or curve
Fit a straight line to the overall distribution of points instead of joining neighbouring points with separate line segments. The points should be distributed roughly evenly on both sides of the line. Do not force the line through the origin. Keep the line no thicker than half a small square. You may exclude anomalous points that have been circled or labelled.
Find the gradient
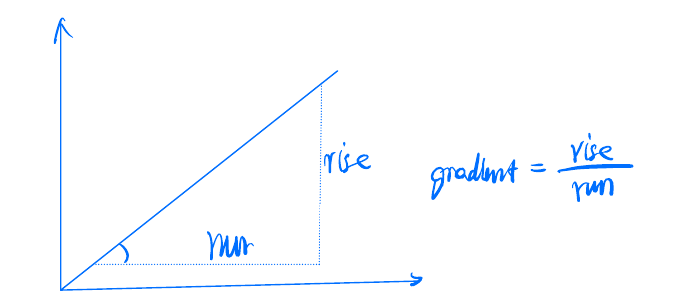
Gradient = Δy/Δx = rise/run. Choose two points on the best-fit line and draw a large triangle. Do not substitute two measured points from the table: read two points on the fitted line itself. The triangle’s hypotenuse should be longer than half the drawn line. Read both coordinates to half a small square. Check the sign, powers of ten and units. The gradient has units: vertical-axis units divided by horizontal-axis units, so include them in your answer.
Intercept and physical constants
Method 1: Substitute a correctly read point on the best-fit line into y = mx + c. Use the gradient m found in the previous part, read one pair of coordinates (x, y) from the line, and solve for the y-intercept c.
Method 2: Read the intercept directly from the graph at x = 0, to half a small square. When the horizontal axis starts at zero, the y-intercept can be read from the graph.
Examples
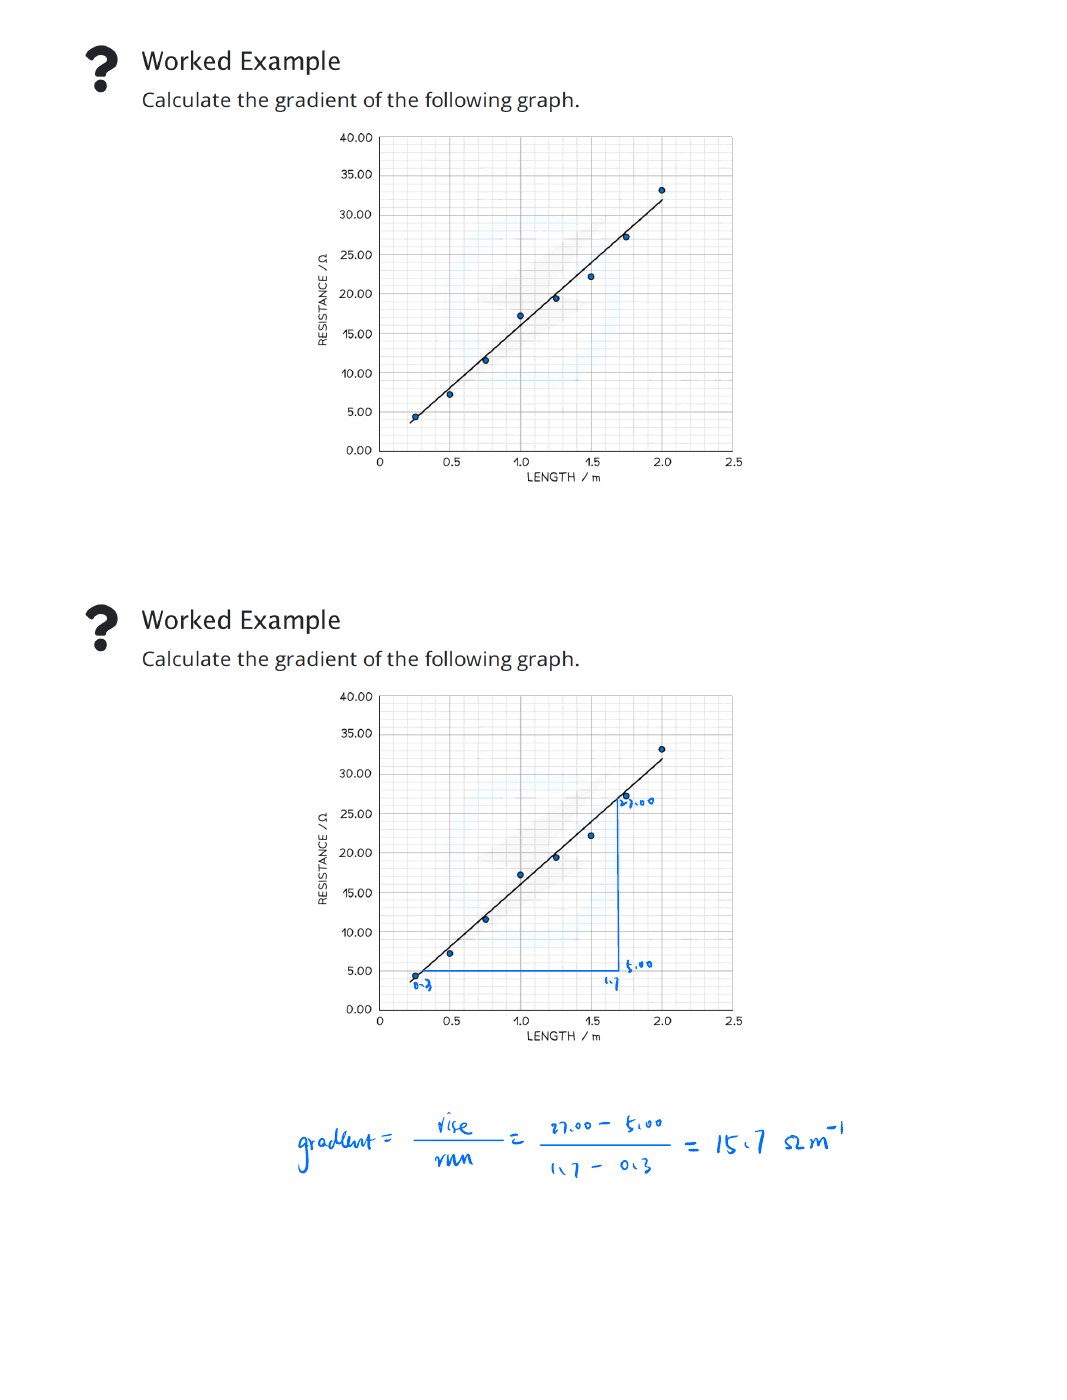
Choose axis scales that use most of the grid. Label each axis with its quantity and unit, draw a best-fit line, then use a large triangle on that line to calculate the gradient.